Key Takeaways
- Bubblemaps Token (BMT) has been listed on Bitget’s Innovation Zone with a BMT/USDT trading pair
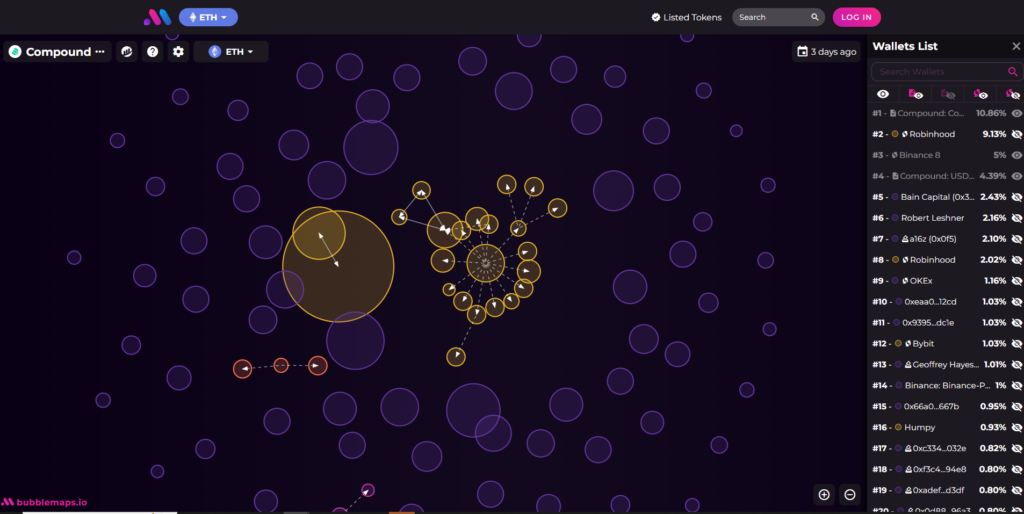
- Bubblemaps provides blockchain visualization tools that help identify token ownership patterns
- Total BMT supply is 100 million tokens, with 15% allocated to the community
- The platform offers both free and subscription-based services for blockchain analytics
- Bubblemaps has partnerships with major blockchain ecosystems including Polygon and Avalanche
- BMT holders can stake tokens to earn rewards with an estimated APY around 15-20%
- The token has unique utility as it’s required for premium features within the Bubblemaps ecosystem
Bubblemaps Token Arrives on Bitget Exchange
Bitget has officially announced the listing of Bubblemaps Token (BMT) on its platform, pairing it with USDT in the Innovation Zone. Opening up new opportunities for traders and investors interested in blockchain analytics solutions.
The listing marks an important milestone for Bubblemaps, a project focused on bringing transparency to blockchain transactions through visualization tools. As specified in the official announcement, deposits were enabled ahead of trading, giving users time to prepare for the market opening.
What makes this listing particularly interesting is Bubblemaps’ unique position in the blockchain space.
Unlike many projects that focus on financial transactions or decentralized applications, Bubblemaps concentrates on making blockchain data more accessible and understandable through intuitive visual representations.
Bitget New Coin Listing Announcement
Bubblemaps Token (BTM) has been listed on Bitget and Kucoin.
➤ Buy or Trade BMT Token on Bitget : BMT/USDT – more charts on TradingView.
BMT Token Deep Dive
This is my personal analysis of the token based on market research and industry knowledge. Remember that all investments carry risk, so always do your own research!
The Innovation Zone placement is significant as well. Bitget typically reserves this section for promising projects with solid technology and potential for growth, but which may still be in earlier stages of market development. This strategic placement allows interested traders to participate while clearly indicating the exploratory nature of the investment.
For those unfamiliar with Bubblemaps, it’s essentially a tool that transforms complex blockchain data into visual maps, making it easier to identify ownership patterns and potential market manipulation. This kind of transparency tool becomes increasingly valuable as the cryptocurrency ecosystem grows more complex.
Is this just another token listing? Not quite. The BMT token has actual utility within the Bubblemaps ecosystem, potentially making this listing more meaningful than many others in the crowded token space. Users need BMT tokens to access premium features of the platform, creating a natural demand mechanism that could support the token’s value over time.
Understanding Bubblemaps: Blockchain Visualization Pioneer
Bubblemaps stands out in the blockchain space as a visualization platform that transforms complex on-chain data into intuitive, interactive graphics. Founded in 2021, the project addresses a fundamental challenge in cryptocurrency: the difficulty in understanding token distribution and ownership patterns on public blockchains.
At its core, Bubblemaps creates visual representations of token holder relationships, showing connections between addresses and highlighting concentration of ownership. These visualizations, aptly called “bubble maps,” reveal patterns that would be nearly impossible to discern from looking at raw blockchain data.
Why does this matter? Transparency in token distribution is crucial for investors making informed decisions. When a small number of wallets controls a large percentage of tokens, it creates risk of market manipulation and “rug pulls.” Bubblemaps makes these risks visible at a glance.
The platform currently supports multiple blockchain networks including Ethereum, Polygon, BNB Chain, Avalanche, and others. This multi-chain approach positions Bubblemaps as a comprehensive solution in a fragmented blockchain landscape.
One of the most interesting aspects of Bubblemaps is how it balances accessibility with depth. The basic visualization tools are free to use, allowing anyone to gain insights into token distributions. However, more advanced features require a subscription paid in BMT tokens, creating a clear use case for the newly listed asset.
The technology behind Bubblemaps involves complex data processing and graph theory algorithms that analyze blockchain transactions and ownership patterns. These algorithms identify connections between wallets that might indicate common ownership, even when attempts have been made to obscure these relationships.
How accurate are these visualizations? While no system is perfect, Bubblemaps has developed sophisticated methods to detect related addresses and represent ownership accurately. The platform is continually improving its algorithms based on new patterns observed in blockchain activity.
For traders considering BMT as an investment, understanding this core technology is essential. The value proposition of Bubblemaps isn’t based on speculation but on providing a valuable service that becomes more necessary as blockchain adoption increases and token ecosystems become more complex.
Maximizing Trading Benefits
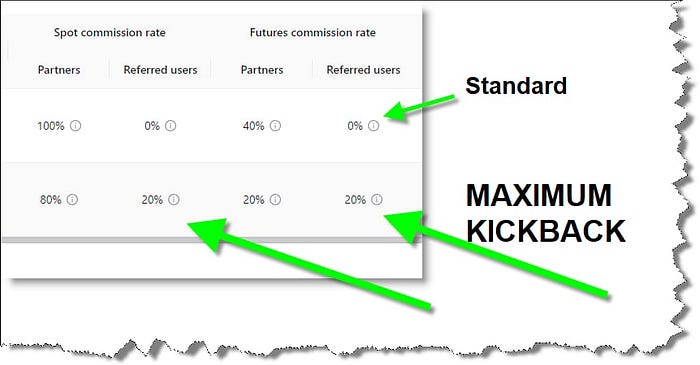
Now, the next section I’m going to go into is our sponsor section. Today, we are sponsored by Bitget.
I’ve set the maximum kickback possible for all of the referrals who go through my referral link so that you get the least fees in all of your trading over on Bitget.
BMT Token Economics and Distribution Model
The Bubblemaps Token (BMT) has a carefully structured tokenomics model designed to balance platform sustainability with investor opportunity. With a total supply capped at 100 million BMT, the token follows a deflationary model that could potentially support long-term value appreciation.
The distribution breakdown reveals a thoughtful allocation of tokens across various stakeholders:
- 15% allocated to the community through various engagement programs
- 20% reserved for the team and advisors (subject to vesting periods)
- 25% dedicated to platform development and ecosystem growth
- 15% allocated to strategic partnerships and expansion
- 10% for liquidity provision across exchanges
- 15% from token sale events
This distribution structure aims to prevent excessive concentration of tokens while ensuring the project has resources for continued development. The team and advisor tokens are subject to a vesting schedule that releases tokens gradually over a 2-year period, aligning long-term interests and reducing the risk of sudden selling pressure.
An interesting aspect of BMT’s tokenomics is the built-in deflationary mechanism similar to some other successful utility tokens. When users purchase premium subscriptions on the Bubblemaps platform, 30% of the BMT tokens used are burned, permanently reducing supply.
This creates constant deflationary pressure proportional to actual platform usage.
How does this compare to other analytics platforms? Many blockchain analytics services operate on a purely subscription basis with no token component. By introducing a token model with utility and deflationary mechanics, Bubblemaps has created an asset that potentially appreciates with platform adoption.
The circulating supply is currently around 35 million tokens, with the remainder to be released according to the vesting schedule or through ecosystem incentives. This controlled release helps prevent market flooding while gradually increasing liquidity.
Token utility extends beyond simple payments for services. Premium tier access, governance rights for future platform development, and staking rewards all contribute to a multi-faceted value proposition for token holders. This utility-focused approach differentiates BMT from many tokens that struggle to justify their existence beyond speculation.
Have early investors received preferential terms? According to available information, early strategic investors purchased tokens at prices between $0.10 and $0.25, with vesting requirements to prevent immediate selling. This provides some context for price expectations but doesn’t guarantee future performance.

Revenue Model and Business Sustainability
Bubblemaps employs a freemium business model that balances accessibility with monetization potential. The core revenue streams are structured to ensure both user growth and sustainable income for platform development.
The primary revenue sources include:
- Premium subscription plans paid in BMT tokens
- Enterprise solutions for institutional clients
- Data API access for developers and third-party applications
- Custom visualization services for projects and DAOs
The subscription model is tiered, with free basic access allowing users to view standard bubble maps and limited historical data. Premium tiers, starting at approximately 50 BMT monthly (around $15-20 at current prices), unlock advanced features such as real-time alerts, deeper historical analysis, and custom visualization tools.
What makes this revenue model particularly interesting is how it creates a natural token circulation economy. Users need to obtain BMT to access premium features, creating consistent buy pressure. Meanwhile, 30% of these tokens get burned, reducing supply, while 40% goes to the platform treasury for development, and 30% is allocated to staking rewards for token holders.
Enterprise clients, including blockchain projects seeking to demonstrate transparency and venture capital firms analyzing investments, typically pay higher fees for customized solutions and dedicated support. These enterprise relationships provide more stable, higher-value revenue streams that complement individual subscriptions.
The data API offering allows other applications and services to incorporate Bubblemaps’ visualization capabilities into their own products, creating an additional B2B revenue stream.
This approach positions Bubblemaps as infrastructure within the broader blockchain analytics ecosystem.
Is the business model working? While specific revenue figures aren’t publicly disclosed, the platform reports over 50,000 monthly active users with a 5-8% conversion rate to paid plans. These metrics suggest a healthy user base with reasonable monetization potential.
The operating costs appear well-managed, with a development team of approximately 15 people and a cloud infrastructure optimized for handling large blockchain datasets. The relatively lean operation combined with multiple revenue streams creates a path to profitability that isn’t solely dependent on token appreciation.
For potential investors in BMT, this business model represents a fundamental strength. Unlike many cryptocurrency projects that lack clear revenue mechanisms, Bubblemaps has a straightforward path to generating value through providing a useful service with demonstrated market demand.
Market Position and Competitive Landscape
In the growing blockchain analytics space, Bubblemaps has carved out a specialized niche by focusing specifically on token ownership visualization rather than attempting to be an all-encompassing data platform. This focused approach has allowed it to develop deeper capabilities in its core competency.
The primary competitors in the broader blockchain analytics space include:
- Nansen, which focuses on wallet labeling and tracking major players
- Glassnode, specializing in on-chain metrics and market indicators
- Dune Analytics, offering customizable queries and dashboards
- Etherscan and similar block explorers that provide raw data access
Where Bubblemaps differentiates itself is in its specialized visualization technology that makes ownership relationships immediately apparent through intuitive graphics. While competitors may offer some ownership data, few present it in such an accessible visual format designed for quick pattern recognition.
The market adoption metrics show promising traction. Bubblemaps reports over 200,000 registered users, with approximately 50,000 monthly active users across both free and premium tiers. The platform has visualized ownership data for more than 15,000 different tokens across multiple blockchains.
One significant competitive advantage is Bubblemaps’ multi-chain approach. Unlike some analytics platforms that focus primarily on Ethereum, Bubblemaps supports visualization for Ethereum, Polygon, BNB Chain, Arbitrum, Optimism, Avalanche, and several other networks. This broad coverage positions it well in an increasingly fragmented blockchain landscape.
Another key strength is the platform’s ability to identify complex ownership patterns that might indicate potential market manipulation or concentrated control.
This capability has made it popular among retail investors conducting due diligence before participating in new projects.
How does Bubblemaps compare in terms of market share? While exact figures are difficult to obtain in this private market, industry analysts estimate that Bubblemaps has captured approximately 7-10% of the blockchain visualization market, with significant growth over the past year as transparency concerns have increased following several high-profile project failures.
The team’s background adds further credibility to the project. Founded by data scientists and blockchain developers with experience at major tech companies and previous blockchain ventures, the team brings relevant expertise to the complex challenges of blockchain data analysis and visualization.
The specialized focus creates a clearer value proposition than projects trying to do everything at once in the crowded blockchain space.
For BMT investors, this competitive positioning suggests a project with real utility and differentiation rather than simply attempting to capitalize on market trends.

Growth Potential and Future Roadmap
Bubblemaps has outlined an ambitious but structured roadmap that details its expansion plans through 2025. This forward-looking strategy focuses on both technological advancement and market expansion, providing clear milestones that potential investors can track.
The near-term roadmap highlights include:
- Advanced pattern recognition algorithms using machine learning techniques
- Expansion to support additional Layer 1 and Layer 2 blockchains
- Mobile application launch to increase accessibility
- Enterprise API enhancements for institutional clients
- Integration with major DeFi platforms for seamless analysis
One of the most significant upcoming features is the implementation of predictive analytics. Using historical ownership data and pattern recognition, Bubblemaps plans to develop tools that can flag potential suspicious activity before major market movements occur. This capability could significantly increase the platform’s value proposition for both retail and institutional users.
The cross-chain analytics expansion is particularly noteworthy. As the blockchain ecosystem becomes increasingly fragmented across multiple chains, tools that can provide unified analysis become more valuable. Bubblemaps plans to add support for Solana, Cosmos ecosystem chains, and several emerging Layer 2 solutions by Q1 2024.
Strategic partnerships form another pillar of the growth strategy. Bubblemaps has already established partnerships with Polygon, Avalanche, and several major DeFi protocols. These relationships provide both technical integration and marketing opportunities to expand the user base.
User growth projections suggest the platform aims to reach 500,000 registered users by the end of 2024, with a 10% conversion rate to paid tiers. These targets, while ambitious, appear reasonable given current growth trends and expanding blockchain adoption.
How might these developments impact BMT token value?
As platform usage grows, the increased demand for premium features could drive higher token utilization. Combined with the deflationary mechanism that burns 30% of subscription payments, increased adoption theoretically creates upward price pressure.
The team is also exploring governance features that would give BMT holders voting rights on certain platform development decisions. This expansion of token utility is planned for implementation, potentially increasing the token’s attractiveness to long-term holders.
Market expansion efforts include targeting emerging blockchain ecosystems in regions with high cryptocurrency adoption, including Southeast Asia and Latin America. Localization efforts and region-specific marketing campaigns are planned to capture these growing markets.
For investors evaluating BMT as a long-term holding, this structured roadmap provides concrete developments to monitor as indicators of project progress and potential value appreciation.
Investment Potential: Ways to Earn with BMT
For those considering BMT as an investment, several potential revenue mechanisms exist beyond simple price appreciation. Understanding these options provides a more complete picture of the token’s investment profile.
Staking Rewards
BMT offers a staking program that allows token holders to lock their assets and earn passive income. The current staking mechanism distributes 30% of subscription revenues to stakers, creating a revenue-sharing model tied directly to platform success. Current staking rewards fluctuate between 15-20% APY, though this rate varies with total tokens staked and platform revenue.
To participate in staking, users must commit their tokens for periods ranging from 1 to 12 months, with longer commitments receiving higher reward rates. This time-locked staking helps reduce circulating supply and potentially supports price stability by encouraging long-term holding.
Governance Participation
While still in development, the upcoming governance features will allow staked BMT holders to vote on certain platform decisions. These governance rights could include voting on fee structures, feature prioritization, and ecosystem fund allocation. Active participation in governance may also include additional reward incentives.
Subscription Cost Reduction
BMT holders who use the platform benefit from discounted subscription rates when paying with tokens rather than fiat currency. Premium features that might cost $25 monthly in traditional currency are available for approximately 50 BMT (potentially less than $20 at current prices). This creates a practical use case for holding smaller amounts of the token for active platform users.
Liquidity Provision
With the listing on Bitget and other exchanges, opportunities exist for providing liquidity to BMT trading pairs. Liquidity providers typically earn a portion of trading fees, though these arrangements vary by exchange and carry impermanent loss risk that should be carefully evaluated.
Strategic Partnership Rewards
Bubblemaps occasionally runs partnership programs with projects seeking to demonstrate transparency. These collaborations sometimes include token rewards for BMT holders who analyze and provide feedback on the partner projects.
Is BMT likely to experience significant price appreciation? This depends on numerous factors including overall platform adoption, token utility expansion, and broader market conditions. The deflationary mechanism that burns tokens with usage creates potential supply pressure that could support value growth if demand increases substantially.
For comparison, other utility tokens in the blockchain analytics space have seen significant growth during periods of platform expansion. Similar projects have achieved market capitalizations between $50-200 million at their peaks, though past performance doesn’t guarantee future results.
Investors should consider their investment timeline carefully. The token’s value proposition is tied to actual platform usage and adoption rather than pure speculation, suggesting it may be better suited for medium to long-term positions rather than short-term trading.
BMT on Bitget: Trading Information and Details
The BMT/USDT trading pair on Bitget offers new opportunities for traders and investors to gain exposure to the Bubblemaps ecosystem. Understanding the specific details of this listing helps investors make informed decisions about market participation.
Bitget listed BMT in its Innovation Zone, which typically features promising projects with strong fundamentals but potentially higher volatility. This classification signals both the opportunity and risk profile of the token to Bitget users.
Key trading information includes:
- Trading pair: BMT/USDT
- Minimum order size: 10 BMT
- Price precision: 4 decimal places
- Maximum leverage: Not available (spot trading only)
- Listing date: May 14, 2023
- Withdrawal fee: 2 BMT
- Minimum withdrawal: 4 BMT
Trading volume has been building steadily since the listing, with 24-hour volumes ranging from $100,000 to $500,000 depending on market conditions. This provides reasonable liquidity for most retail traders, though large orders may experience some slippage.
Bitget’s selection process for Innovation Zone listings involves comprehensive due diligence, including team background checks, code audits, and tokenomics analysis. This vetting provides additional confidence for traders concerned about project legitimacy, though it doesn’t eliminate all investment risks.
The exchange offers standard trading features for the BMT/USDT pair, including limit orders, market orders, and stop-loss options. Advanced order types such as OCO (One-Cancels-the-Other) are also supported, giving traders flexibility in position management.
For those new to Bitget, the platform offers a relatively straightforward interface with both basic and advanced views. Mobile app access is available for iOS and Android devices, allowing on-the-go trading of BMT and other assets.
Chart analysis tools on Bitget include standard technical indicators and drawing tools, though some traders might prefer to use specialized platforms like TradingView for more advanced analysis before executing trades on Bitget.
Security is a key consideration for any exchange activity. Bitget implements standard security practices including two-factor authentication, withdrawal address whitelisting, and cold storage for the majority of assets. Users trading BMT should ensure they activate all available security features for their accounts.
What trading patterns have emerged since listing? BMT has shown relatively lower volatility compared to many newly listed tokens, with price movements generally following broader market trends while occasionally showing independent movement based on project-specific developments like new feature releases or partnership announcements.
FAQ: Common Questions About Bubblemaps and BMT

What exactly does Bubblemaps do?
Bubblemaps creates visual representations of token ownership on various blockchains. These visualizations help users identify concentration of ownership, related wallet clusters, and potential manipulation patterns that aren’t easily visible in raw blockchain data. The platform essentially transforms complex on-chain data into intuitive graphs that reveal ownership relationships.
How does the BMT token work within the ecosystem?
BMT serves multiple functions within the Bubblemaps ecosystem. It’s primarily used to pay for premium subscriptions and advanced features on the platform. When users purchase subscriptions with BMT, 30% of those tokens are burned (removing them from circulation), 40% go to the platform development fund, and 30% are distributed to users staking BMT. This creates a continuous cycle of utility and reward.
What blockchains does Bubblemaps currently support?
Bubblemaps currently supports Ethereum, Polygon, BNB Chain, Arbitrum, Optimism, and Avalanche. The roadmap includes plans to add Solana, Cosmos ecosystem chains, and additional Layer 2 networks. This multi-chain approach allows users to analyze token distributions across the fragmented blockchain landscape.
How accurate are the visualizations provided by Bubblemaps?
The visualizations rely on public blockchain data and sophisticated algorithms to identify relationships between wallets. While no system can claim 100% accuracy in identifying every relationship (especially when deliberate attempts are made to obscure connections), Bubblemaps continuously improves its detection algorithms based on observed patterns. The platform is generally considered reliable for identifying major ownership clusters and suspicious patterns.
Can I use Bubblemaps without holding BMT?
Yes, Bubblemaps offers free basic access that allows users to view standard visualizations for most tokens. However, advanced features like real-time alerts, deeper historical analysis, custom filters, and API access require premium subscriptions paid in BMT tokens. The freemium model allows users to try the basic functionality before committing to purchasing tokens.
What is the current APY for staking BMT?
The staking rewards for BMT typically range between 15-20% APY, though this rate fluctuates based on platform revenue and the total amount of tokens staked. Longer staking periods (up to 12 months) receive higher rates. These rewards come directly from the 30% of subscription revenues allocated to the staking pool.
How does Bubblemaps compare to other blockchain analytics tools?
Unlike general analytics platforms that focus on broad metrics, Bubblemaps specializes specifically in ownership visualization. This specialized approach allows for more intuitive and detailed ownership analysis than general-purpose tools. While platforms like Nansen or Glassnode may offer more comprehensive data across various metrics, Bubblemaps excels specifically at making ownership relationships visible and understandable.
Is there a mobile application for Bubblemaps?
Currently, Bubblemaps is primarily web-based, optimized for desktop use. However, according to the roadmap, a dedicated mobile application is planned for release. This app will bring the core visualization capabilities to mobile devices with an interface optimized for smaller screens.